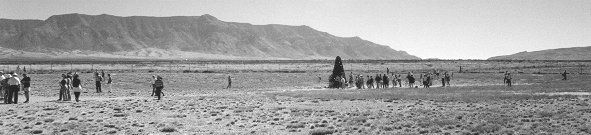
Radiation drops off with distance from ground zero as would be expected. The highest radiation was not measured at the monument, however, but to the North. In the early 1950's the military bulldozed most of the Trinitite from the site and partially filled the crater with fresh dirt to cut down on the radiation levels. Maybe the dirt added was thinner in this region or something of that sort. That appears to be the case from the photo below. The monument is seen to the right of center. The higher radiation region is to the left and the lower radiation region is to the right. The region of the crater to the left of the monument indeed looks deeper than that to the right. As a reference, the people at the far left of the image are standing in front of the "Fat Man" type bomb casing.
 |
|---|
| Uneven Crater Depth |
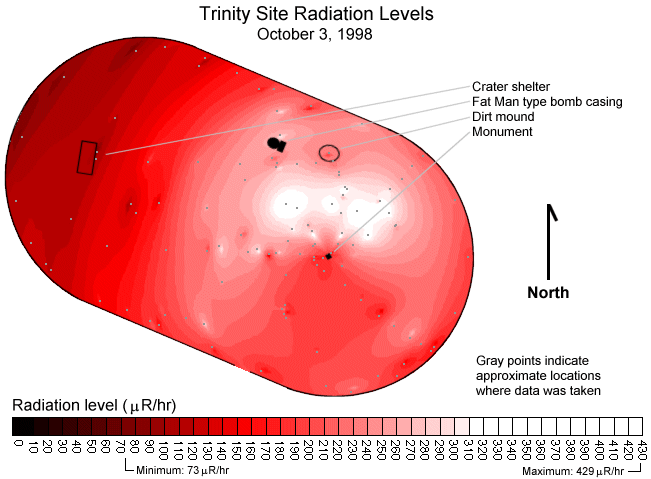
The data in the plot is not extremely accurate as a sufficient number of readings were not taken to fully cover the area. The small gray dots show the approximate location where each data point was measured. These are only rough locations for several reasons. First, civilian GPS is not accurate enough for this sort of mapping so other sources of location information had to be used. At many of the points where readings were taken, photographs were taken of the monument with the local mountains in the background. Later USGS topographic maps were used to draw lines through the monument and the part of the mountains seen directly behind the monument in these photos. The measurment point obviously lies along this line. The position along this line was determined from sketches made at the site. In addition, the number of paces between data points were recorded as well as notes such as "half way between monument and gate". This information helped pin down the final locations. There is another important uncertainty in the data. The handheld computer works by counting radiation pulses from the Geiger counter during a fixed time period. Using calibration data, this pulse count and the length of the time interval are then used to back out the radiation level. The integration time was set to one minute and thus the level measured is an average for where the unit was during this minute. In many cases the unit was being moved to the next location during these times so there is no exact location the readings correspond to. A "best guess" estimate was made of the average location where the readings apply. Note that there are several "hot" and "cold" spots in the map. Many of these probably occur because of points that are not accurately located. Fortunately, the unit was held at many points for more than a minute and these locations are more accurate.
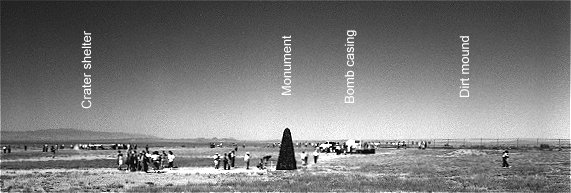
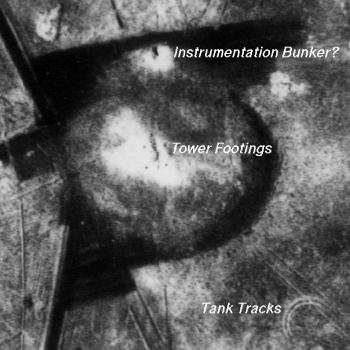
The photos below show the four items identified in the radiation map at the top of the page. More detailed photos of the monument, crater shelter and bomb casing are included in the "Photos" section. The oddest landmark is the dirt mound which is just that, a grown-over pile of dirt about 2 feet high and maybe 10 feet across. Its location corresponds to what appears to be some sort of instrumentation bunker in the aerial view at right taken 28 hours after the explosion.
 |
 |
|---|---|
| Radiation Map Legend | 1945 Post-explosion Aerial View |
Incidently, the OSHA regulation covering ionizing radiation exposure is 29 CFR 1910.1096.
| Return to Home Page | Latest update: December 28, 1998 |