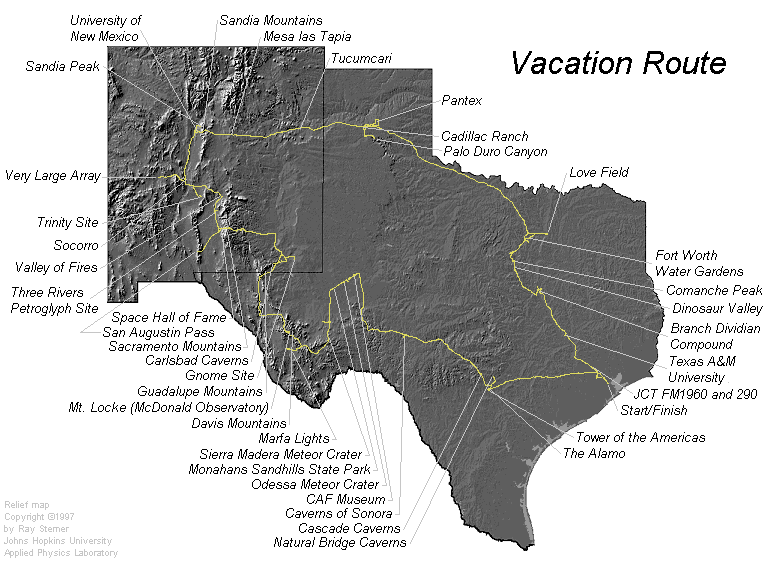
The following image shows the route taken during the vacation. I started in Houston, just North of Webster and proceeded clockwise around the large loop shown in yellow for a total of 3597 miles. The position data used to plot the path was obtained from the GPS receiver at one minute intervals. The sites identified in the image are also shown on the radiation map later on this page. The shaded relief map supplies a qualitative estimate of the elevation along the path.
The following (rather wide) plot shows the complete radiation history for my trip. The data is plotted vs. the total elapsed time the instruments had been turned on at any given point in the trip. They were off at night and these gaps have been removed from the data.
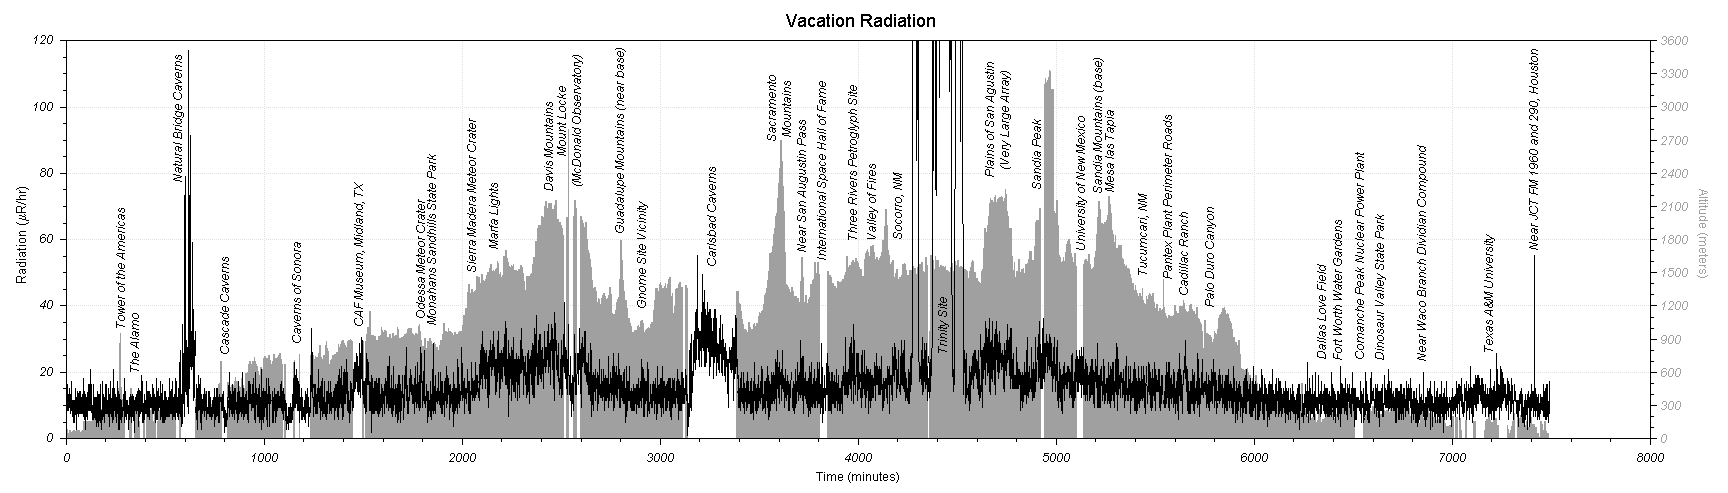
There are two sets of data on the plot. The gray background represents the elevation above sea level as measured by the GPS receiver. Indoors and underground the receiver could not pick up the GPS satellites resulting in the gaps seen in this curve. The black, noisy line is the radiation level as measured by the Geiger counter. Each point is the average radiation level for a one minute period of time. The plot is annotated with many of the locations the data corresponds to. Note that there was some back-tracking during the trip which may make the ordering of the data a little confusing in a few spots.
The most striking effect in the plot is that of the Trinity Site itself. The peak radiation level measured was about 450 µR/hr on the ground Northwest of ground zero. This agrees quite well with the 0.5 mR/hr rate quoted by the brochure they hand out. To put this in perspective, the peak radiation measured after the test was 6000 R/hr (6,000,000,000 µR/hr) at the "safe" distance of 30 yards from ground-zero 12 hours after the test1. By this time the radiation was estimated to be only about 1/20th of what it was one hour after the explosion. Back to the present day, the rather wide region of low radiation early in the visit is during the tour of the McDonald ranch house a couple of miles away from ground zero. A second, narrower region late in the visit is from a trip to the parking lot about a quarter of a mile from ground zero.
Other nuclear related sites on the trip showed no increase in radiation above the natural background although no readings could be taken at all close to where the action was. Readings were taken near the site of the Gnome underground nuclear test near Carlsbad, from country roads ringing the Pantex nuclear weapons assembly plant in Amarillo, Texas and at the visitor's center for the Comanche Peak Nuclear Power Plant near Glen Rose, Texas.
I visited four caverns on this trip which yielded the opportunity to see the effects of going underground on the radiation count. The most interesting effect is in Natural Bridge Caverns near San Antonio, Texas. Here the peak radiation jumped to about 20% of the peak at Trinity Site. One possible source may have been Radon gas but the actual cause is unknown. A friend took a more sensitive instrument to the cavern in 2005 and did not detect any increase in radiation. A less pronounced but still easily measured increase is seen in Carlsbad Caverns and a barely detectible jump is seen in part of the Caverns of Sonora near Boerne, Texas. Decreases in radiation, possibly due to cosmic rays being attenuated by the surrounding rock, are seen in other parts of the Caverns of Sonora and in Cascade Caverns.
The effect of radiation on altitude can also be seen in the plot. Higher elevations are associated with slight increases in radiation level with distinct jumps at mountain locations such as the Davis Mountains in West Texas, on the elevated plains where the VLA radio telescopes are located and on Sandia Peak, the highest point visited.
There are a few rather curious points in the data. One is a slight increase above the background radiation at the Confederate Air Force Museum in Midland, Texas. The same sort of thing is seen at Texas A&M University. Maybe this has something to do with the stone or bricks used in some of the buildings. Another weird reading is a single point where the radiation hit 58 µR/hr on the freeway on the outskirts of Houston, Texas. This point could, of course, simply be a bad data point due to a glitch in the homemade computer. Two friends took the same instrumentation on a trip along this route in 2005 and no spike in radiation was seen at this location.
| Return to Home Page | Latest update: May 6, 2006 |