1996 BMW 318ti Performance
After building a simple recording accelerometer I decided I needed to try and make some performance measurements of my car. The accelerometer was placed in the back under the hatch and held to the floor with one of the rubber bungees the car comes with. Below are examples of its acceleration and deceleration along a deserted interstate access road.
Acceleration
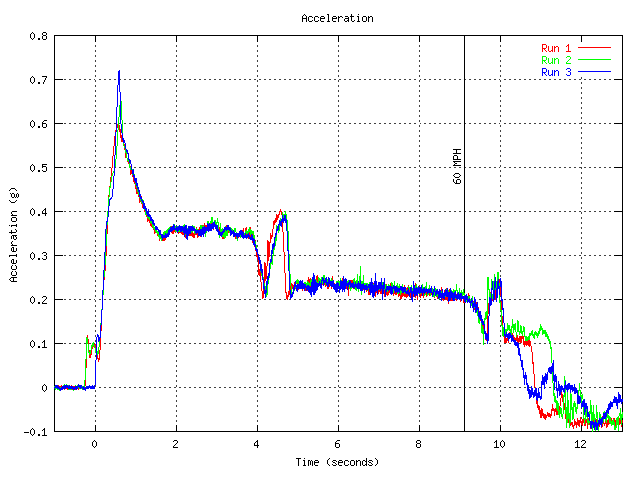
The next plot shows the car's acceleration. Three runs were made, two at the same location and one about a mile farther up the road. The car had the driver, a full tank of gas and the air conditioner running. Something interesting happens at the very start of the runs. There is a region of low acceleration before the velocity really takes off. Since this car has an automatic transmission, this may be a delay between when I released the brake and hit the accelerator. There's also a slim chance it could be due to wheelspin but I don't think that car could possibly spin the tires and I didn't hear it happen. For the plot, I shifted the data so the data with the smallest startup glitch started at time=0. I then shifted the other curves to match the main increase in acceleration.
The shifts are very different that what I expected. I didn't do anything fancy, just put the car in drive and held the gas pedal to the floor. I did notice the car shifted from 1st to 2nd at about 6000 RPM and 2nd to 3rd at almost 6400. My intent was to measure the 0-60 MPH times and I reached 60 while still in second.
After reaching 60 I backed off in very different ways on the three runs so there is a lot of scatter in the data after about 10 seconds.
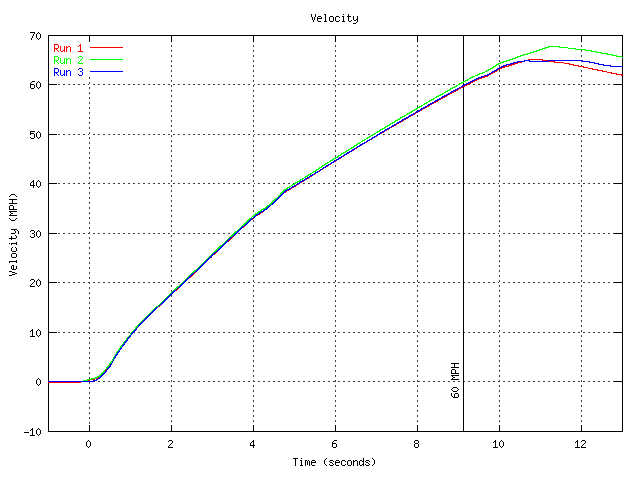
The second plot shows the velocity vs. time for the three runs. The average 0-60 time was 9.1 seconds.
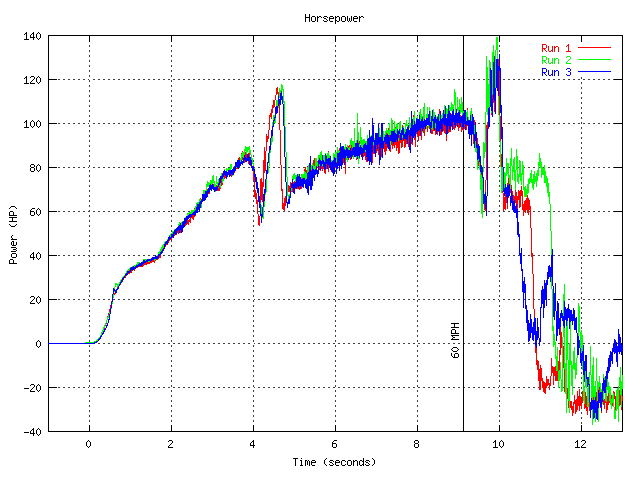
The final plot in this section shows the horsepower at the rear wheels calculated from this data. The power was calculated assuming a vehicle weight of 2833 lbs, a drag coefficient of 0.34, a frontal area of 20.6 ft**2 and a measured freestream density of 0.00232 slugs/ft**3.
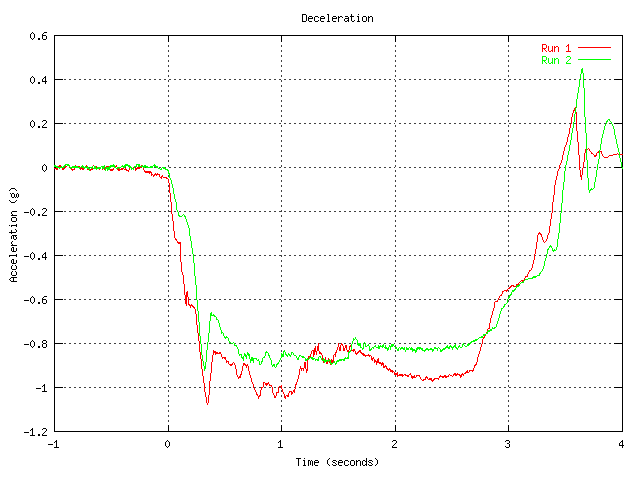
Deceleration
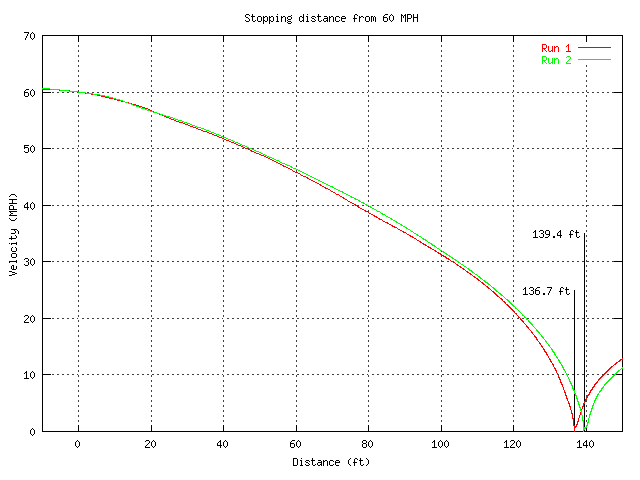
After doing the acceleration tests I did two tests of the braking performance. The first plot shows the measured acceleration for the two tests. There was a slight deceleration in the first run before braking began in earnest. I may have applied the brakes more gently than I intended or who knows what else happened. The braking performance is similar between the runs although the second run doesn't reach quite as high levels of deceleration as the first. The second run was made within about 1 minute of the first so maybe there was a slight performance change due to a change in brake temperature. Also, the second run occurred about 2 miles farther down the road and the road surface could have been different. This run also left the car rocking back and forth after the stop more than the first run as seen about 3.5 seconds after hitting the brakes.
The final plot shows the braking distance for the two runs. The idea was to measure the stopping distance from 60 MPH. The speedometer reads approximately 3 MPH low at 60 MPH so braking was begun at a slightly higher speed. For this reason, the distance doesn't include the distance travelled while depressing the pedal etc. The gradual slope through 60 MPH leads me to believe the distances derived this way have a large uncertainty. Despite this, the two runs yielded stopping distances within about 2% of each other.